Accounting Matt Valentine•May 16, 2026
7 Property Management Financial Reports Every Manager and Owner Needs
Matt Valentine•May 16, 2026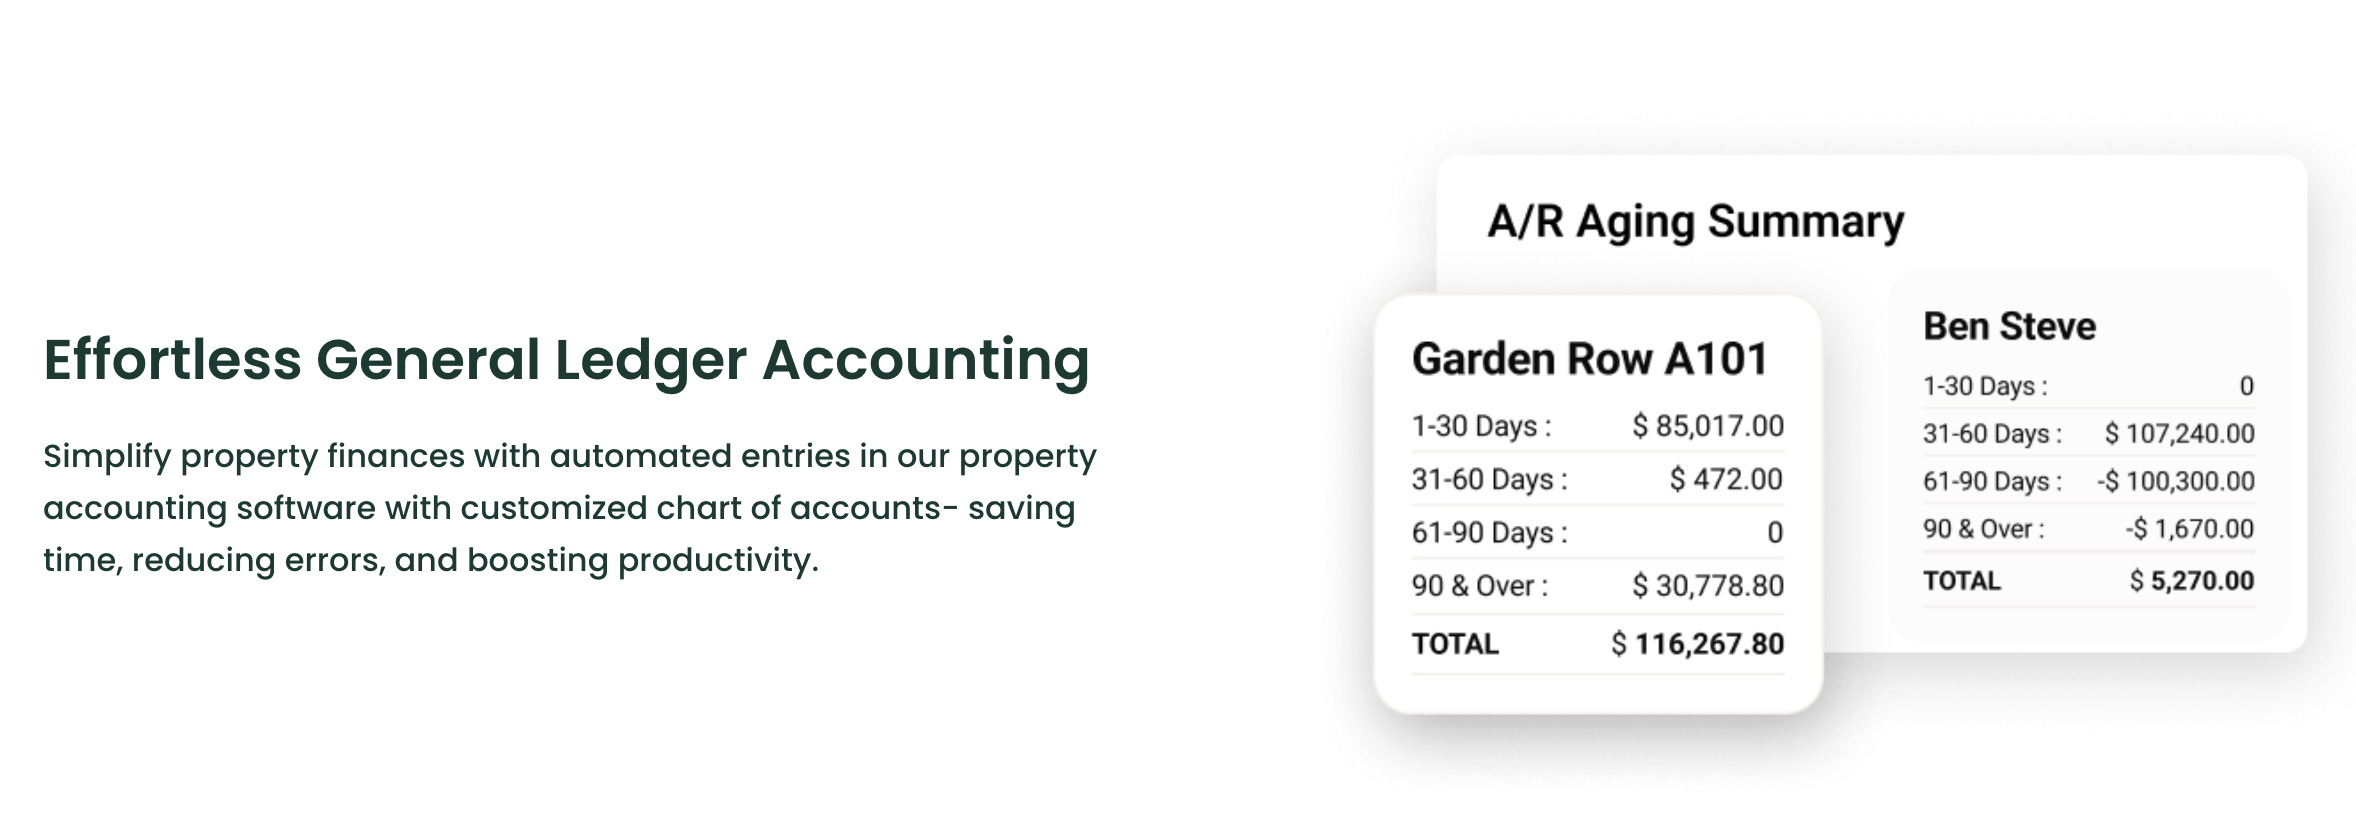 Matt Valentine•May 16, 2026
Most property managers and landlords think they know how their portfolio is performing.
They have a sense. A gut feel. They remember which properties had repairs last month and which tenants were late on rent. They can ballpark the income and the expenses without looking.
That’s not enough.
The difference between a managed portfolio and a guessed-at one comes down to financial reports. The actual documents that turn every transaction into information you can use. Without them, you’re operating on memory and instinct. With them, you can see exactly where you’re making money, where you’re losing it, and what to do about both.
This guide walks through the financial reports every property manager and self-managed landlord should be running regularly. What each one shows. How to read it. And the patterns that signal something worth investigating.
Financial reports are the bridge between accounting and decision-making.
Your accounting system records every transaction. Rent collected. Vendor bills paid. Insurance premiums. Property taxes. Late fees. The reports turn all that raw data into something you can actually use to run the business.
Here’s what they enable.
Rent increases, capital improvements, refinancing, selling, buying. Every major property decision should start with the numbers. Without consistent reporting, you’re making those decisions based on what you remember, which is rarely the full picture.
For property managers, financial reports are how you communicate performance to your clients. Clean, consistent reports build trust. Messy or late reports erode it.
Year-end tax filing requires income and expense data organized by category. Clean monthly reports throughout the year mean clean year-end reporting, which means fewer headaches and missed deductions.
State real estate commissions, lender requirements, partner reporting, and tax audits all expect to see organized financial records. Reports that match your underlying books are the documentation that protects you.
The earlier you catch a problem, the easier it is to fix. A vacancy trend, a creeping maintenance cost, or a tenant who’s falling behind on rent shows up in reports weeks before it becomes a crisis.
Most property managers run a handful of standard reports every month. Each one answers a different question. Together, they give you a complete picture of how your portfolio is performing.
Here’s the overview before we dig into each one:
| Report | What It Shows | How Often | Best For |
|---|---|---|---|
| Income Statement (P&L) | Revenue, expenses, and net income for a period | Monthly | Profitability tracking |
| Balance Sheet | Assets, liabilities, and equity at a point in time | Monthly or Quarterly | Financial position and solvency |
| Cash Flow Statement | How cash moved in and out during the period | Monthly | Liquidity and cash management |
| Budget vs. Actual | Planned spending compared to actual spending | Monthly | Variance analysis and forecasting |
| Rent Roll | Active leases, rent amounts, and lease terms | Monthly | Occupancy and revenue tracking |
| Accounts Receivable Aging | Outstanding tenant balances by age | Weekly or Monthly | Collections and delinquency management |
| General Ledger | Complete record of every transaction | As needed | Audit trail and detail verification |
Let’s walk through each one.
The income statement (also called the profit and loss statement or P&L) shows revenue and expenses over a defined period, usually one month.
It’s the report that answers the most basic question: did the property make money?
Start with revenue. Compare it to what you expected. If you had 100% occupancy and on-time rent, did the total match? If not, where’s the gap?
Move to expenses. Look at each category and ask whether the amount makes sense. Sudden spikes deserve investigation. Steady increases over time may signal a vendor pricing problem or a property that needs more capital investment.
Then look at NOI. This is the metric most owners and investors care about. A growing NOI means the property is becoming more profitable. A shrinking NOI means something needs attention.
Keep in mind, a single bad month doesn’t tell you much. Comparing this month to last month, this month to the same month last year, and year-to-date totals against last year reveals the patterns that single-month numbers hide.
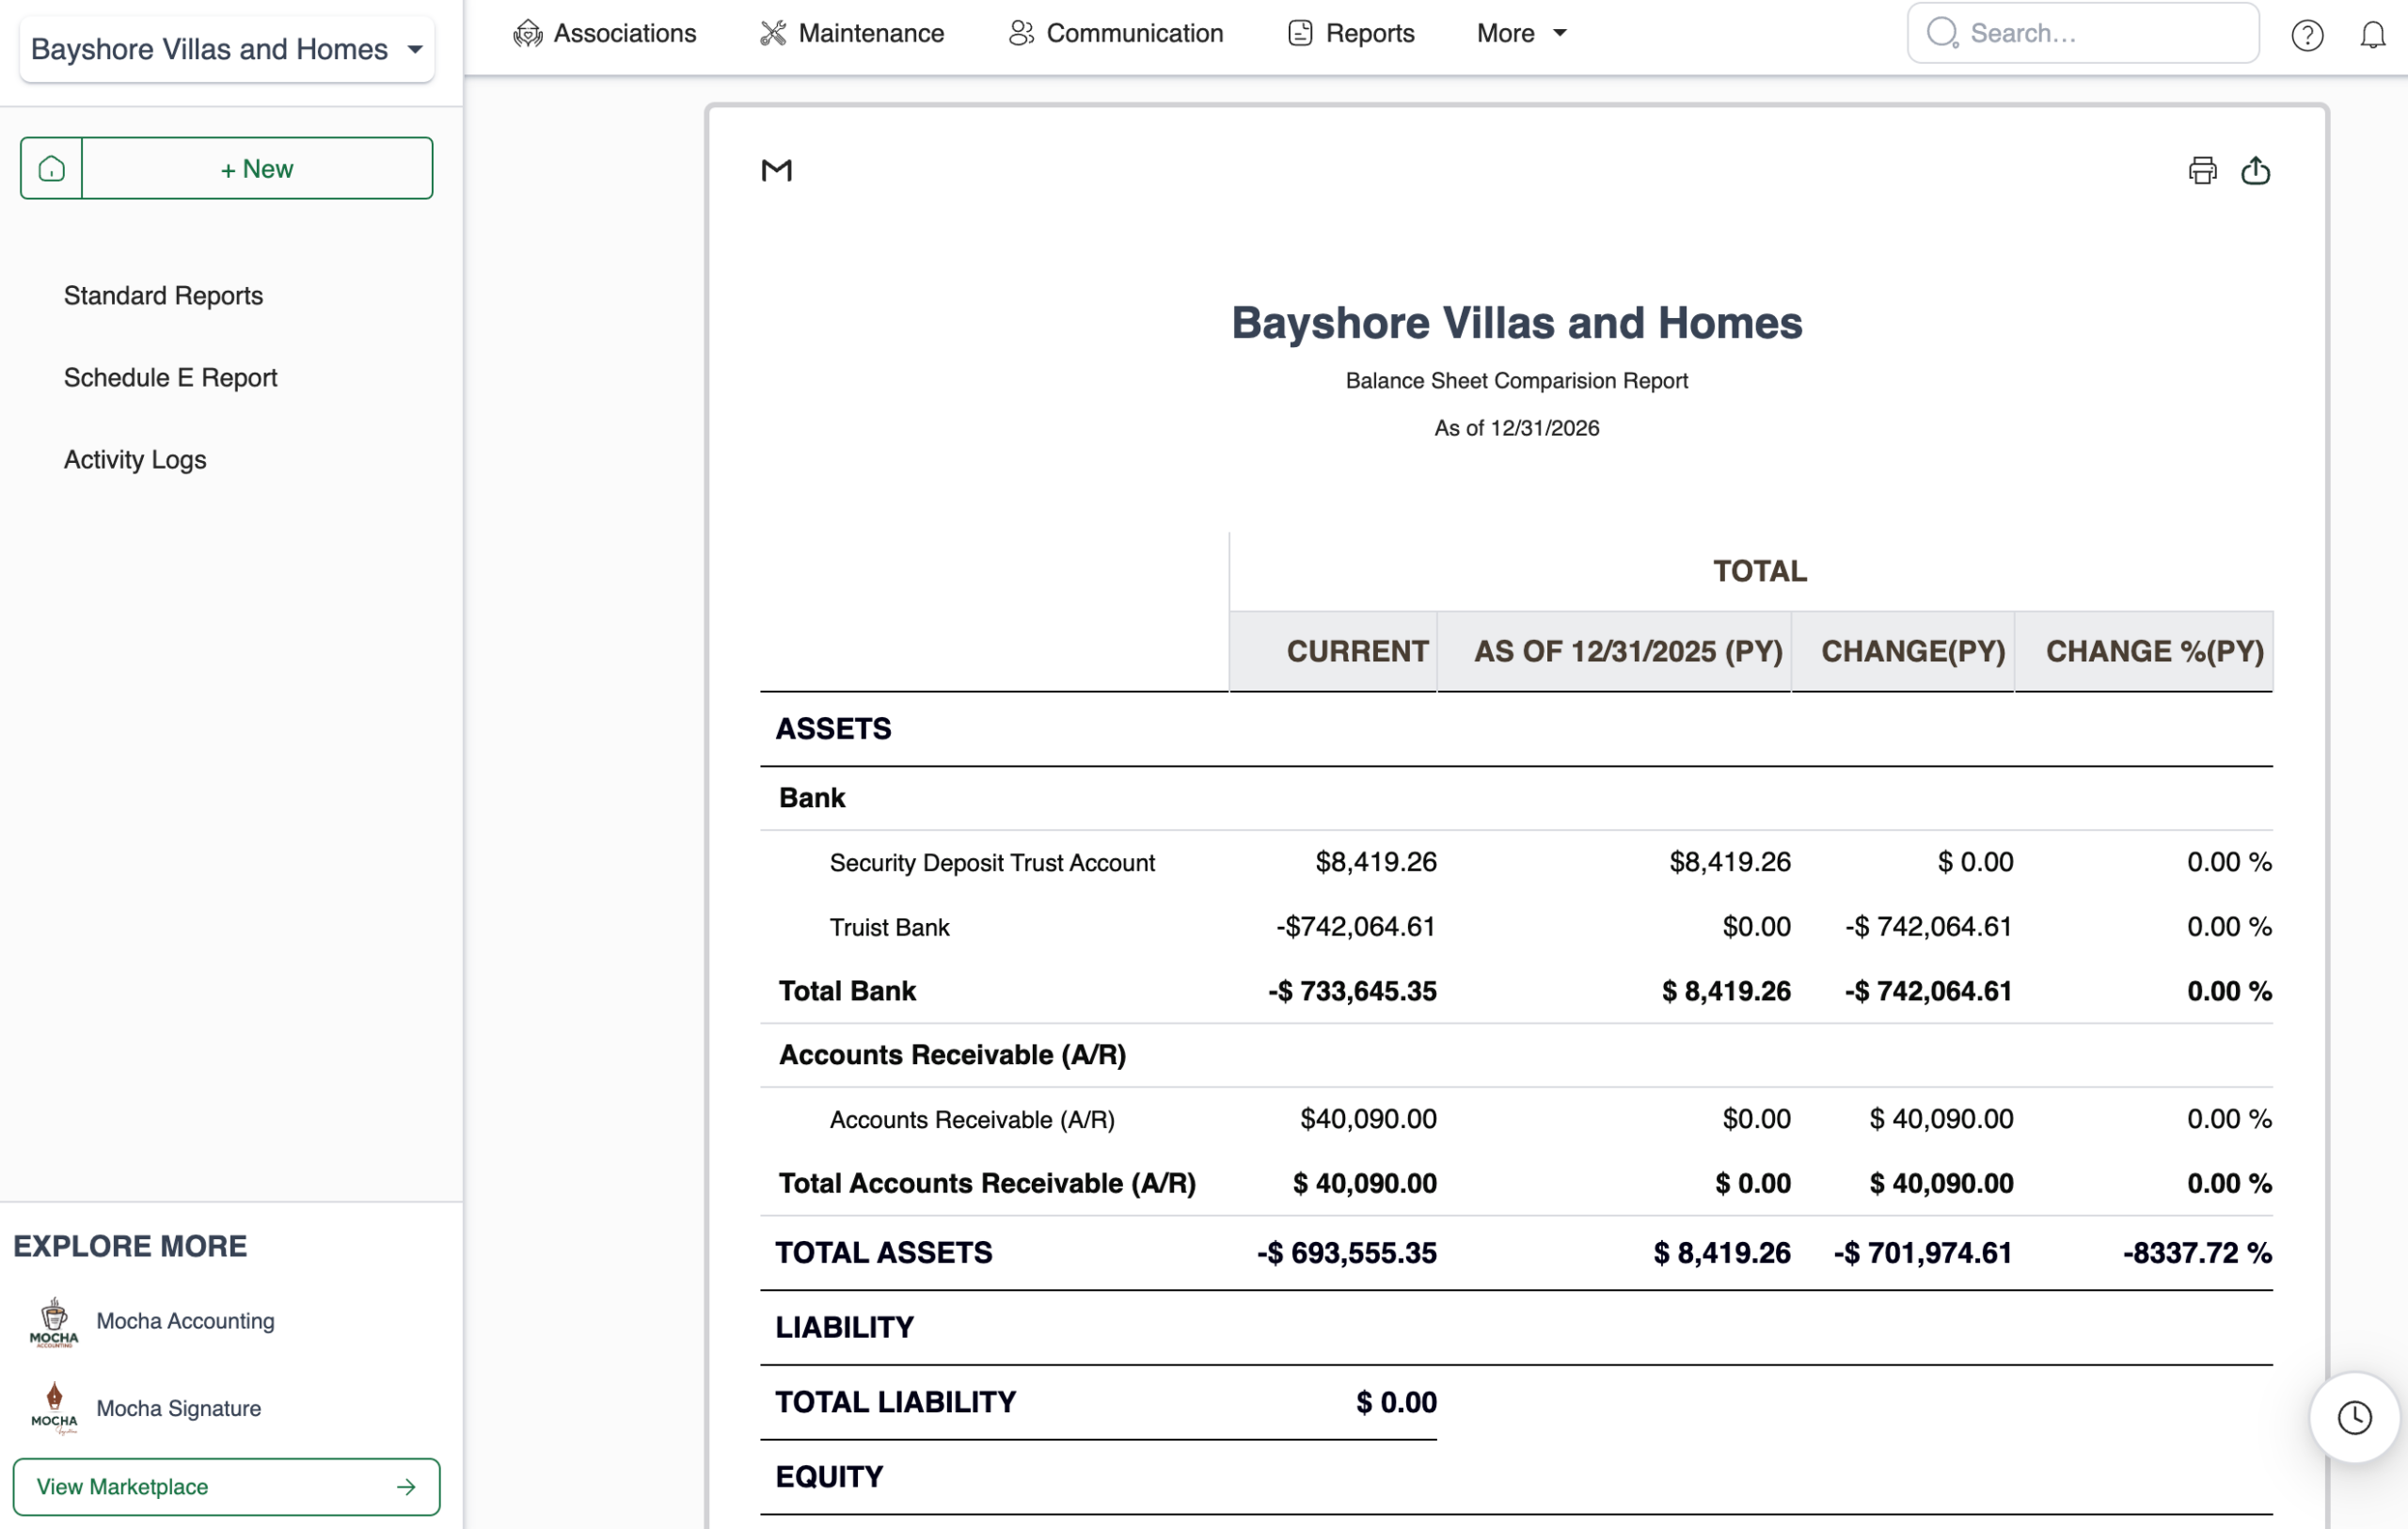
The balance sheet is a snapshot of your financial position at a specific point in time. It’s organized into three sections: assets, liabilities, and equity.
The fundamental equation is simple:
Assets = Liabilities + Equity
If those two sides don’t balance, something is wrong with the underlying books.
For property managers, the balance sheet reveals trust account compliance. Security deposits should appear as a liability (you owe them back to tenants) backed by an equal asset in your trust account. If those numbers don’t match, you have a compliance issue.
For self-managed landlords, the balance sheet shows debt levels and equity build-up over time. Property values appreciate. Mortgage balances decline. The difference between the two grows into real wealth that doesn’t show up on the income statement.
The truth is, most operators don’t look at their balance sheet often enough. Monthly is the right cadence, but even quarterly review catches major issues before they grow.
The cash flow statement tracks how cash actually moved in and out of the business during the period. It’s separate from the income statement because cash flow and profit aren’t the same thing.
A property can be profitable on paper but cash-flow negative if it’s investing in capital improvements. A property can show a loss but be cash-flow positive if depreciation is high.
The cash flow statement is organized into three sections:
Operating cash flow is the most important section for day-to-day management. It tells you whether your collections are keeping pace with your expenses.
Investing cash flow tells you whether you’re putting money back into the property. Some negative investing cash flow is healthy (capital improvements protect long-term value). Persistent zero investing cash flow may mean deferred maintenance is building up.
Financing cash flow shows debt service and owner draws. For self-managed landlords, this is where you see how much cash actually came out of the property and into your pocket.
Budget vs. actual reports compare what you planned to spend against what you actually spent. They’re essential for forecasting, variance analysis, and identifying issues before they compound.
Focus on the variances, especially large ones. A 5% variance is usually noise. A 25% variance demands an explanation.
The most useful budget vs. actual reports include short narrative notes explaining why variances occurred. “Maintenance over budget due to HVAC replacement at 123 Main Street” is more useful than just a red number. The note tells you whether the variance is a one-time event or a sign of a larger pattern.
Having said that, the budget itself has to be realistic for the report to be useful. A made-up budget produces meaningless variances. Spend the time to build a real budget at the start of each year, and the monthly variance reports will earn it back many times over.
The rent roll is an operational report rather than a pure financial one, but it’s essential for property management. It shows every active lease in your portfolio.
The rent roll surfaces problems before they hit your P&L. Upcoming lease expirations. Tenants on notice. Vacancies. Below-market rents that should be raised at renewal.
For investors evaluating a property purchase, the rent roll is the first document they ask for. It shows the income reality of the property, not just the projected income.
The AR aging report shows every tenant balance owed, categorized by how old the debt is.
Outstanding balances grouped into aging buckets:
The older a balance, the less likely you are to collect it. AR over 90 days old should be flagged for escalation (collections, eviction proceedings, or write-off).
The total AR aging number also tells you how much rent you’ve billed but haven’t received. If that number is climbing, your collections process needs attention.
For property managers, the AR aging report is a critical operational document. Reviewing it weekly (not monthly) catches small delinquencies before they grow.
The general ledger is the complete record of every financial transaction in your books. It’s the source of truth that every other report pulls from.
Every transaction with:
You don’t read the general ledger end-to-end. You search it. When the P&L shows a number that looks wrong, you drill into the underlying GL transactions to figure out why.
A clean general ledger means every other report you produce is reliable. A messy GL means even the cleanest-looking summary reports are suspect.
Reports are most useful when paired with metrics. The same income statement can look healthy or alarming depending on the context, and metrics provide that context.
Here are the metrics worth tracking across reports:
| Metric | Formula | What It Tells You |
|---|---|---|
| Net Operating Income (NOI) | Revenue – Operating Expenses | True operating profit (excludes financing and depreciation) |
| Occupancy Rate | Occupied Units ÷ Total Units | Demand and revenue health |
| Operating Expense Ratio | Operating Expenses ÷ Revenue | Cost efficiency |
| Cap Rate | NOI ÷ Property Value | Return on investment as a percentage |
| Cash-on-Cash Return | Annual Cash Flow ÷ Cash Invested | Actual cash yield on invested capital |
| Debt Service Coverage Ratio | NOI ÷ Debt Service | Ability to cover loan payments |
| Gross Rent Multiplier | Property Value ÷ Annual Gross Rent | Valuation shortcut for comparable properties |
| Delinquency Rate | Past-Due AR ÷ Total Rent Billed | Collections health |
Each of these metrics pulls from your financial reports. Tracking them month over month and year over year reveals the trends that single-period snapshots miss.
Different reports serve different purposes, which means they should run on different schedules.
Most operators settle into a rhythm that looks something like this:
The truth is, most property managers under-run their reports. Producing them monthly and reviewing them as part of a regular financial review meeting catches problems early and gives owners predictable reporting they can plan around.
Most reporting issues come from the same handful of mistakes. They’re easy to avoid once you know what to watch for.
Reports are only as accurate as the accounting underneath them. If your AP workflow has miscoded expenses or your bank reconciliation is months behind, your reports will reflect those problems. Fix the accounting first.
Portfolio-wide totals hide property-level performance. A portfolio P&L might show healthy NOI even when half the properties are losing money. Run reports at both the portfolio and property level.
A budget vs. actual report without explanations is just a list of numbers. Adding brief narrative notes to significant variances turns the report into an actual decision-making tool.
Comparing this month’s report to last quarter’s, or running a “monthly” report that covers different date ranges each time, makes the comparisons meaningless. Standardize your reporting periods.
A standalone monthly number is useful. The same number compared to the prior month, the same month last year, and year-to-date averages is dramatically more useful. Comparison columns should be standard.
The biggest reporting mistake is producing reports because you have to, then filing them away without reviewing them. The point isn’t generating the report. It’s using it to make decisions.
If you’re producing financial reports by exporting transactions from one system into spreadsheets in another, you already know how easy it is for small errors to undermine the whole report. Miscoded categories. Allocation issues. Reconciliation gaps. Each one is a number that doesn’t quite mean what it’s supposed to.
Mocha Manage was built by CPAs who understand financial reporting from both sides: as managers producing reports for owners and as accountants making sure those reports actually match the books:
Our reporting and accounting features are designed to give you reports you can trust, quickly, and all baked into our native accounting suite (no QuickBooks integration required, unlike other property management tools).
Here’s how Mocha helps you stay on top of your financial reporting:
The result is financial reporting you can actually trust. Built on accounting that’s already correct. Available at any level of detail. Delivered consistently and on time.
Try Mocha Manage free to see what property management financial reporting looks like when the accounting underneath is built for it from day one.
What are the most important property management financial reports?
The income statement, balance sheet, and cash flow statement are the foundation. Beyond those, the rent roll, AR aging, budget vs. actual, and general ledger round out the core reporting package.
How often should I run financial reports?
Monthly is the standard cadence for most reports. AR aging and rent roll should be reviewed weekly. Balance sheet and quarterly/annual summaries add longer-term perspective.
What’s the difference between a P&L and a cash flow statement?
The P&L shows profitability (revenue minus expenses). The cash flow statement shows actual cash movement, which can differ from profit due to timing, depreciation, and capital investments.
How do I know my reports are accurate?
Reports are only as accurate as the underlying accounting. Reconcile bank accounts monthly, code expenses correctly, and maintain a clean chart of accounts. If those are in order, your reports will be reliable.
What’s net operating income (NOI)?
NOI is revenue minus operating expenses, before debt service and depreciation. It’s the metric most owners and investors use to evaluate property performance because it strips out financing and tax decisions.
Should I use the same reports for owner statements?
Owner statements include some of the same data but are formatted specifically for the owner’s view of their property. They typically combine elements of the P&L and cash flow statement with transaction detail and owner distribution information. We cover them in detail in our complete guide to owner statements.
Disclosure: Mocha Manage publishes this blog. This guide is for informational purposes only and does not constitute legal, tax, or accounting advice. Consult a CPA familiar with property management for advice specific to your situation.


